




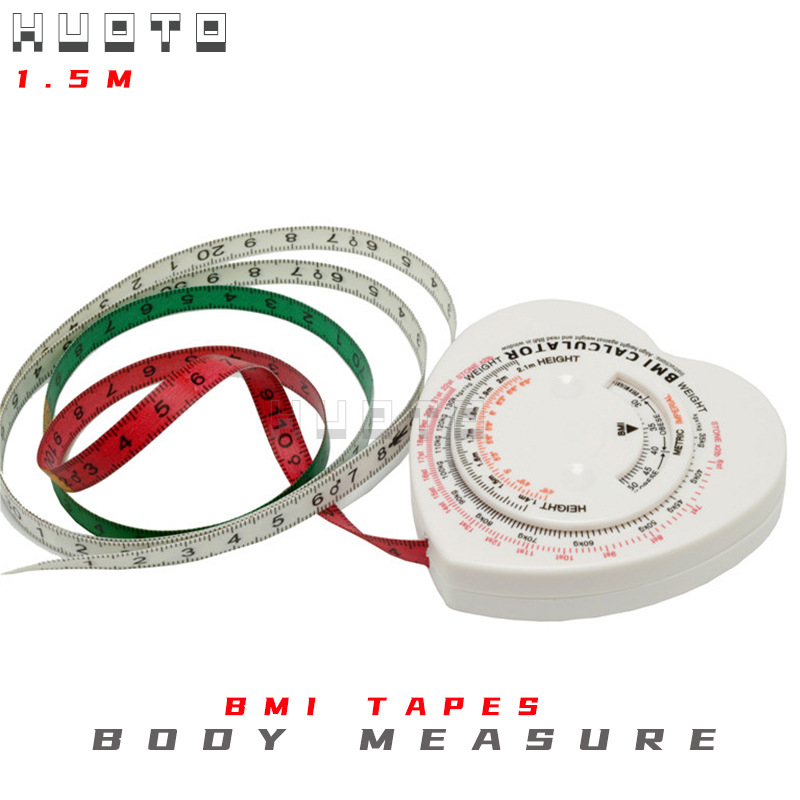




Product: HUOTO 1.5m three -color strap heart -shaped BMI rolling meter -tape…

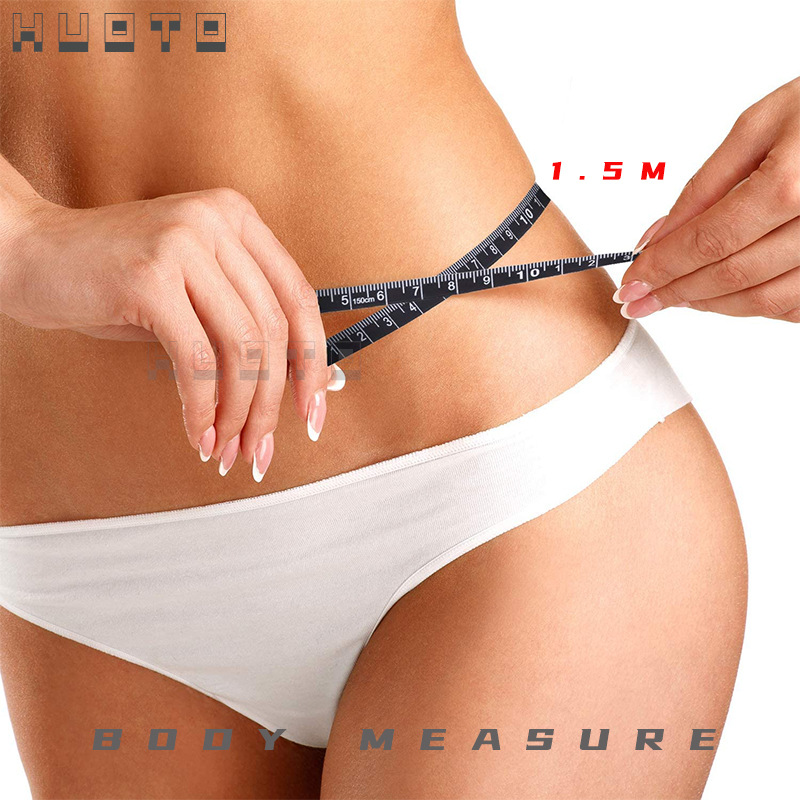
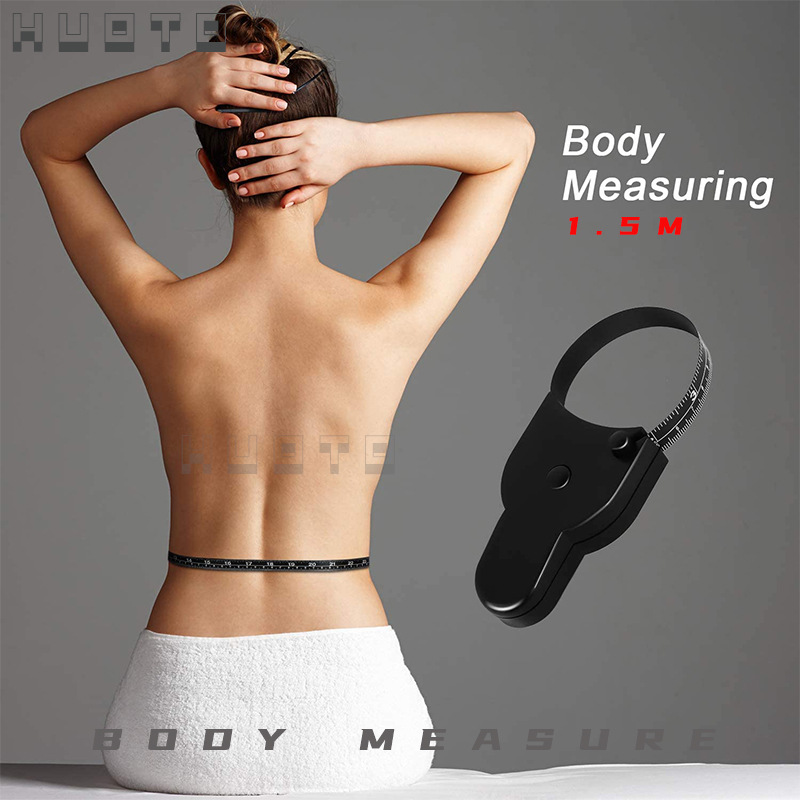





BMI value normal standard value calculation formula
The BMI value was originally designed as a statistical tool for use in public health research.When we need to know whether obesity is the cause of a certain disease, we can convert the patient's height and weight into BMI values, and then find out the difference from the normal standard value and whether there is a linear relationship with the incidence rate.However, with the advancement of technology, this calculation formula is currently only a reference value.To truly measure whether a patient is obese, body fat percentage also needs to be measured.Therefore, its role has gradually changed, from a medical use to a slimming indicator for the general public.
BMI calculation formula explanation
The standard BMI value that is most conducive to health and longevity is 22. Within +10%, it is within the normal and ideal range. It is the same for both men and women. Generally, the lower value is suitable for young people and the higher value is suitable for older people.Based on the BMI value and personal height, the ideal weight of the individual can be calculated.
BMI = weight (kg) / height (m2) |
Obesity is defined as excess body fat.Based on body weight, the normal body fat content is 12% to 20% for men and 20% to 30% for women. The minimum body fat content to maintain health is 3% for men and 10% to 12% for women. Too low body fat content is detrimental to health and women will have symptoms of menopause.Since adults no longer grow, an increase in weight indicates an increase in fat. Therefore, being too tall can represent obesity. According to the regulations of the Ministry of National Defense, the body position of male soldiers in our country is measured by BMI.>33 is exempt; if the athlete has well-developed muscles, he may also have a higher BMI value, but this does not necessarily mean he is obese.
Body mass index also affects how long you live.People with high or low BMI do not live longer than people between 22-25 years old and are more likely to get diseases.Therefore, the importance of maintaining an ideal weight can be seen in general.Body mass index also affects how long you live.According to many research reports, too high a diet will significantly increase the risk of certain diseases.For example:high blood pressure, cardiovascular disease, arthritis, female infertility, etc.The higher the body mass index, the higher the probability of contracting diseases. Body mass index is closely related to health. As long as the body mass index exceeds 24, the risk factors for obesity-related diseases begin to increase.
Normal BMI for adults
In Taiwan, the Department of Health of the Executive Yuan announced Taiwan's adult obesity standards in April 2002 based on its relevant research: <18.5 is underweight, 18.5≦BMI<24 is normal weight, between 24 and 27 is overweight, and ≧27 is obese.
| Adult weight classification and standards | |
| points class | body mass index |
| underweight | <18.5 |
| normal value range | 18.5 ≦BMI <24 |
| pass Heavy | Between 24 and 27 |
| Being mildly obese | Between 27 and 30 |
| Moderate obesity | Between 30 and 35 |
| Severe obesity | ≧ 35 |
| Source: Food Information Website of Department of Health/Obesity and Weight Control | |
Because BMI does not take into account a person's body fat percentage, a person who is index overweight may not actually be obese.For example, a person who practices bodybuilding may have an index of over 30 because his body weight has a heavy proportion of muscle.If their body fat percentage is low, they don't need to lose weight.
According to statistics from the National Health and Nutrition Examination Survey in 1994, 59% of American men and 49% of American women had a BMI above 25.For people who are extremely overweight, with a score above 40, 2% of men and 4% of women.Health agencies in other countries also have their own statistical values, but generally use the US statistical values as a reference.Ghroubi et al. (2007) examined whether abdominal circumference in obese patients is a better and more reliable indicator of knee osteoarthritis than BMI.They found that it was actually a factor linked to knee pain as well as osteoarthritis in obese subjects.
After expert assessment, the World Health Organization believes that the overweight index of adults in Southeast Asia is lower than the world average.Depending on the situation in each country, the cut-off value for overweight fluctuates between 22 and 25, and the cut-off value for obesity fluctuates between 26 and 31.Therefore, Asian countries have set their own cut-off values for overweight and obesity.For example, in Singapore, the standard for overweight is 23 or above, and the standard for obesity is 27.5 or above.However, for the convenience of statistics and mutual comparison, the World Health Organization recommends that countries report statistical data according to the world average standards at various levels.
Children's BMI standard value
BMI is not just for adults.For growing children, we can also use this to figure out whether they are overweight.The above calculation formula is also applicable to people aged 2-20, but their overweight and underweight indicators are not determined by a fixed BMI.This is because children in different regions have different growth rates. If a fixed value is used, it is easy to make wrong judgments.
YearsLower limitUpper limit
| Infants (over 0 years old (over 3 months)) | 16 | 18 |
| Toddlers (1 to 5 years old) | 15 | 17 |
Many countries and regions conduct height and weight statistics on local children every year.These statistical data can be transformed to calculate the BMI value distribution of local children.Based on this distribution, the local health government can calculate the overweight and underweight indicators of local children.Generally speaking, the statistically calculated average value and its standard deviation are used, and then the highest 5% and the lowest 5% of its normal distribution are calculated as overweight and underweight indicators.On the other hand, children whose BMI values are in the 85%-95% range of the normal distribution are at risk of being overweight.